Stablecoin freezes on October 3, 2026
Across the networks TrustSniffer traces, issuers froze 2 addresses on October 3, 2026, removing about $413.6k in USDT and USDC from circulation.
- Ethereum: 2 freezes, $413.6k frozen
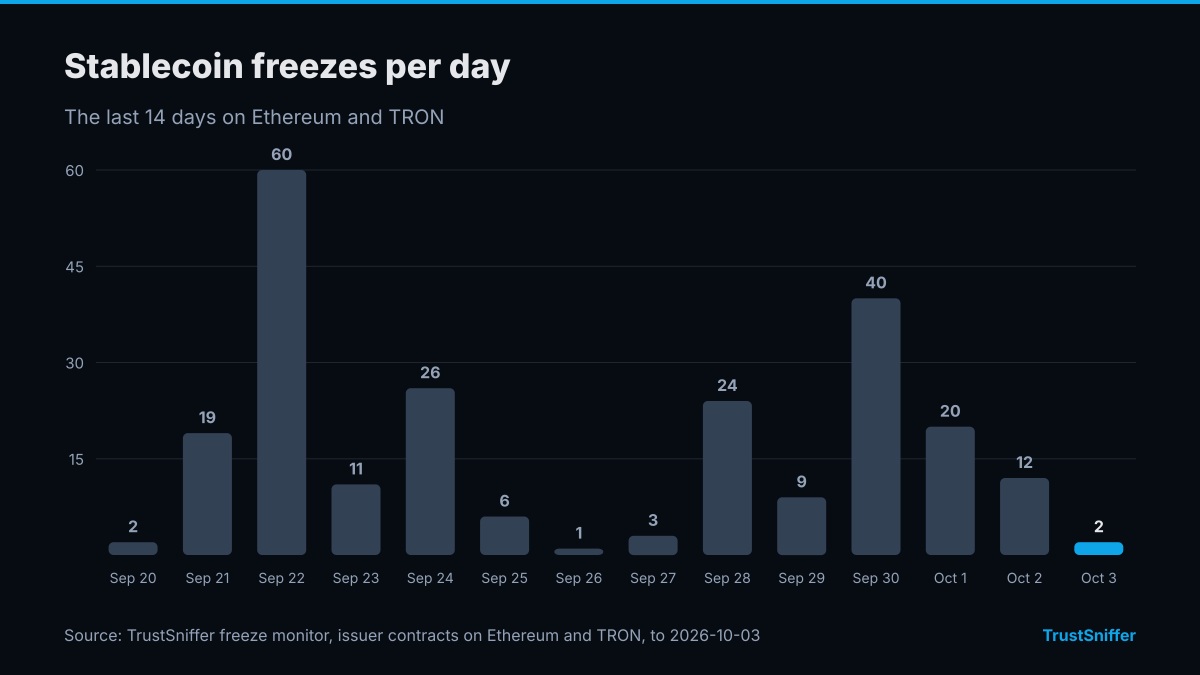
2 freezes, below the 7-day average of 16
The previous seven days averaged 16 freezes a day and about $6.07M frozen daily. Over the last 30 days the daily average was 20, and October 3, 2026 ranks 29th of 31 days by number of freezes. The chart shows each day's count across the last 14 days.
By value the gap is just as wide. The two addresses held about $413.6k between them, against roughly $6.07M frozen on an average day in the week before. Our counts show how often issuers acted, but they do not record why. One quiet day is not a trend on its own, so compare it with the bars around it in the chart.
$406.2k frozen in a single Ethereum address
The single largest freeze on October 3, 2026 was $406.2k on Ethereum, on the address 0x286fF9428C3400e1D901d9b14158f27b3f333420, 98% of everything frozen that day.
The second address, also on Ethereum, held $7.4k when it was frozen. That is the remaining 2% of the day's total.
Wallets frozen on October 3, 2026
All 2 addresses frozen on October 3, 2026, largest first, with the amount each held.
- 0x286fF9428C3400e1D901d9b14158f27b3f333420 on Ethereum, $406.2k frozen
- 0x8c3E09Ec45F8Ae9E21B481526b49378353C33412 on Ethereum, $7.4k frozen
Each address above links to its own on-chain risk page. Open it first to see our analysis of that wallet. If your own address sent funds to one of them or received funds from one, paste it into the wallet-risk checker to check it. If the result is unclear, add your address to wallet monitoring so we keep watching it for you.
If your wallet dealt with one of these addresses
10,894 addresses now frozen across Ethereum and TRON
As of October 3, 2026, TrustSniffer's freeze index counts 10,894 addresses currently frozen by stablecoin issuers across Ethereum and TRON, holding roughly $3.52B in immobilised funds, out of 12,238 addresses ever blacklisted (see the live Risk Index).
The two counts measure different things. The larger figure covers every address an issuer has ever blacklisted. The smaller one counts only the addresses that are still frozen today. Each daily report adds that day's new freezes to both totals.


